How To Implement the Doughnut Graph Using React D3.Js
There are lots of plugins to implement doughnut charts in React.js. But all plugins are not supported for all requirements what developers need. This POC (proof of Content) is done to accommodate following doughnut chart.

As a first step we need to install node.js and create a new react project. For better coding install Visual studio code (You can choose any IDE which supports react.js). Refer follwoing link for installation and project creation.
Once installation and project creation are done install d3 plugin using terminal.
npm install d3Create DrawDoughnutChart.js under src folder and add following code to there.
import * as d3 from "d3";

const DrawDoughnutChart = (element, data) => {
  const colors = ["#d9e3f0", "#8bc34a"]; // green and white
  const boxSize = 1000; // graph boxsize, in pixels
  const width = 640; // outer width, in pixels
  const height = 400; // outer height, in pixels
  const innerRadius = 100; // inner radius of pie, in pixels (non-zero for donut)
  const outerRadius = Math.min(width, height) / 2; // outer radius of pie, in pixels

  d3.select(element).select("svg").remove(); // Remove the old svg

  // Create new svg
  const svg = d3
    .select(element)
    .append("svg")
    .attr("preserveAspectRatio", "xMidYMid meet")
    .attr("height", "100%")
    .attr("width",  "100%")
    .attr("viewBox", `0 0 ${boxSize} ${boxSize}`)
    .append("g")
    .attr("transform", `translate(${boxSize / 2}, ${boxSize / 2})`);

//add first line of text in middle  of doughnut
  svg.append("text")
    .attr("dy", ".35em")
    .attr("text-anchor", "middle")
    .attr("style","font-family")
    .attr("font-size","20")
    .attr("fill","#000000")
    .attr("dy", "0em")
    .text("60% ");

//add second line of text in middle of doughnut
  svg.append("text")
    .attr("dy", ".35em")
    .attr("text-anchor", "middle")
    .attr("style","font-family")
    .attr("font-size","20")
    .attr("fill","#000000")
    .attr("dy", "1em") // how far apart it shows up
    .text("complete")

  const arcGenerator = d3.arc().innerRadius(innerRadius).outerRadius(outerRadius);

  const pieGenerator = d3.pie().value((d) => d.value);

  const arcs = svg.selectAll().data(pieGenerator(data)).enter();
  arcs
    .append("path")
    .attr("d", arcGenerator)
    .style("fill", (d, i) => colors[i % data.length]);

//add label inside doughnut chart
  arcs
    .append("text")
    .attr("text-anchor", "middle")
    .text((d) => `${d.data.value}%`)
    .style("fill","#000000")
    .style("font-size","30px")
    .attr("transform", (d) => {
      const[x,y] = arcGenerator.centroid(d);
      return `translate(${x}, ${y})`;
    });

  const div = d3.select("body").append("div")
    .attr("class", "tooltip-donut")
    .style("opacity", 0);
};

export default DrawDoughnutChart;
Create ChartComponent.js under src folder and add following code there
import React, { useEffect, useRef } from "react";
import DrawDoughnutChart from "./DrawDoughnutChart";

const DonutChart = ({ data }) => {
  const ref = useRef(null);

  useEffect(() => {
    if (ref.current) {
        DrawDoughnutChart(ref.current, data);
    }
    // eslint-disable-next-line react-hooks/exhaustive-deps
  }, [ref]);

  return (
    <div className="container">
      <div className="graph" ref={ref} />
    </div>
  );
};

export default React.memo(DonutChart);
Add following code to App.js
import ChartComponent from "./ChartComponent";

export default function App() {
  const data = [
    { value: 40 },
    { value: 60 }
  ];

  return (
    <div className="App">
      <ChartComponent data={data} />
    </div>
  );
}
Explanation of App.js
In this file we pass data to ‘ChartComponent.js’ which need to show in the chart (All values are hard coded).
build the app
npm run build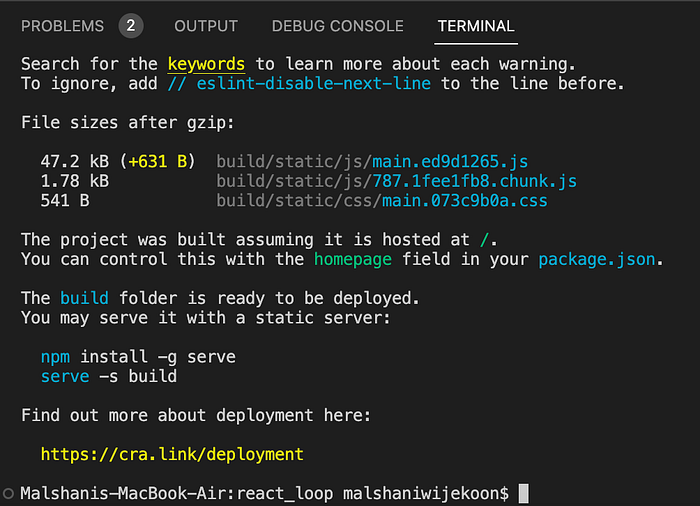
Start the app
npm start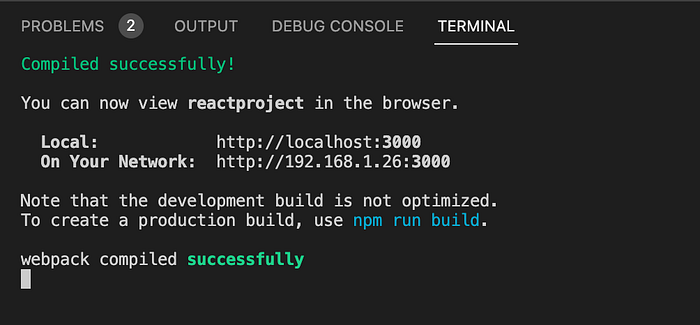
Open the browser and go to http://localhost:3000 (This is according to the local server you used. Here I’m using 3000 port). You will see the chart.
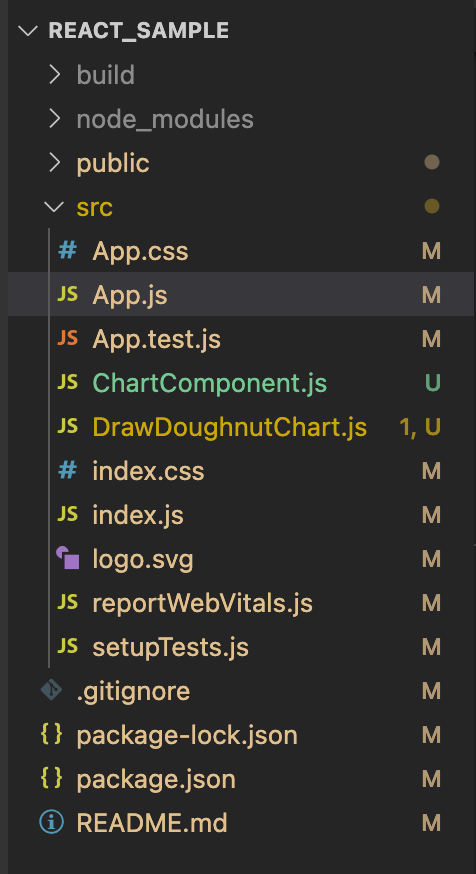
Folder Structure